splot.mapping.vba_legend
- splot.mapping.vba_legend(rgb_bins, alpha_bins, cmap, ax=None)[source]
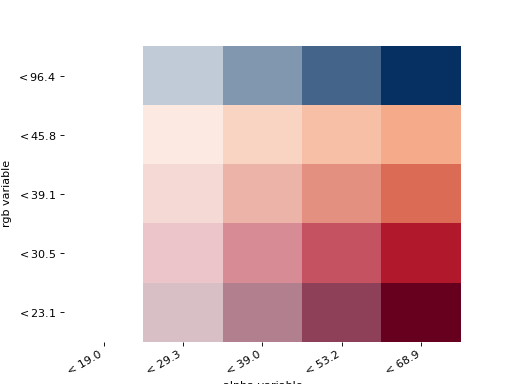
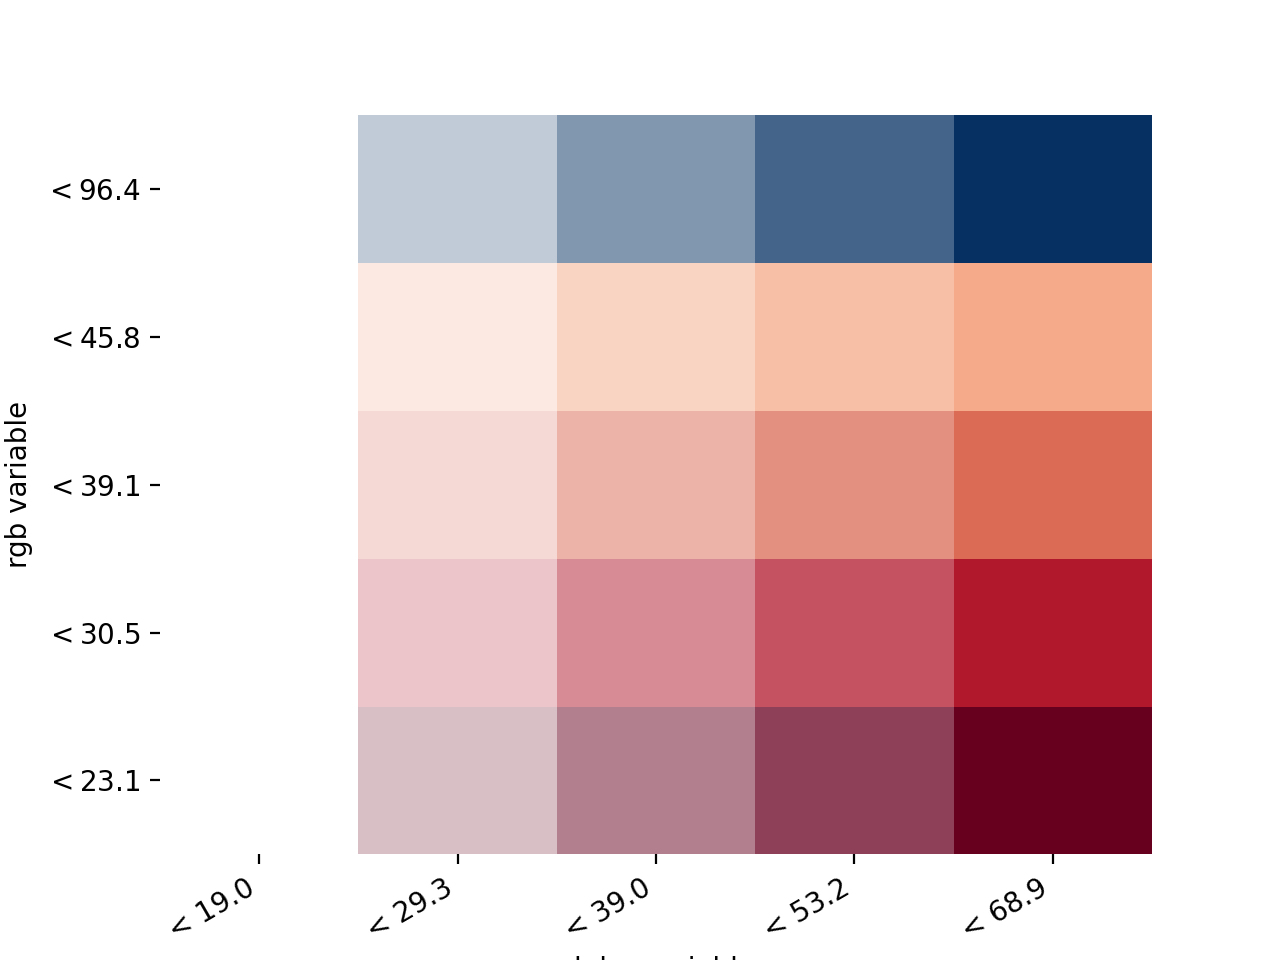
Creates Value by Alpha heatmap used as choropleth legend.
- Parameters
- rgb_binspysal.mapclassify instance
Object of classified values used for rgb. Can be created with mapclassify_bin() or pysal.mapclassify.
- alpha_binspysal.mapclassify instance
Object of classified values used for alpha. Can be created with mapclassify_bin() or pysal.mapclassify.
- axmatplotlib Axes instance, optional
Axes in which to plot the figure in multiple Axes layout. Default = None
- Returns
- figmatplotlip Figure instance
Figure of Value by Alpha heatmap
- axmatplotlib Axes instance
Axes in which the figure is plotted
Examples
Imports
>>> from libpysal import examples
>>> import geopandas as gpd
>>> import matplotlib.pyplot as plt
>>> import matplotlib
>>> import numpy as np
>>> from splot.mapping import vba_legend, mapclassify_bin
Load Example Data
>>> link_to_data = examples.get_path('columbus.shp')
>>> gdf = gpd.read_file(link_to_data)
>>> x = gdf['HOVAL'].values
>>> y = gdf['CRIME'].values
Classify your data
>>> rgb_bins = mapclassify_bin(x, 'quantiles')
>>> alpha_bins = mapclassify_bin(y, 'quantiles')
Plot your legend
>>> fig, _ = vba_legend(rgb_bins, alpha_bins, cmap='RdBu')
>>> plt.show()
(Source code, png, hires.png, pdf)